
Rundocs › Analytics
Dashboards
Last updated 2026-09-11
Dashboards are Rundoo's at-a-glance view of the numbers that matter (revenue, margin, tender-method totals, and department mix) scoped to the date range and location you choose.
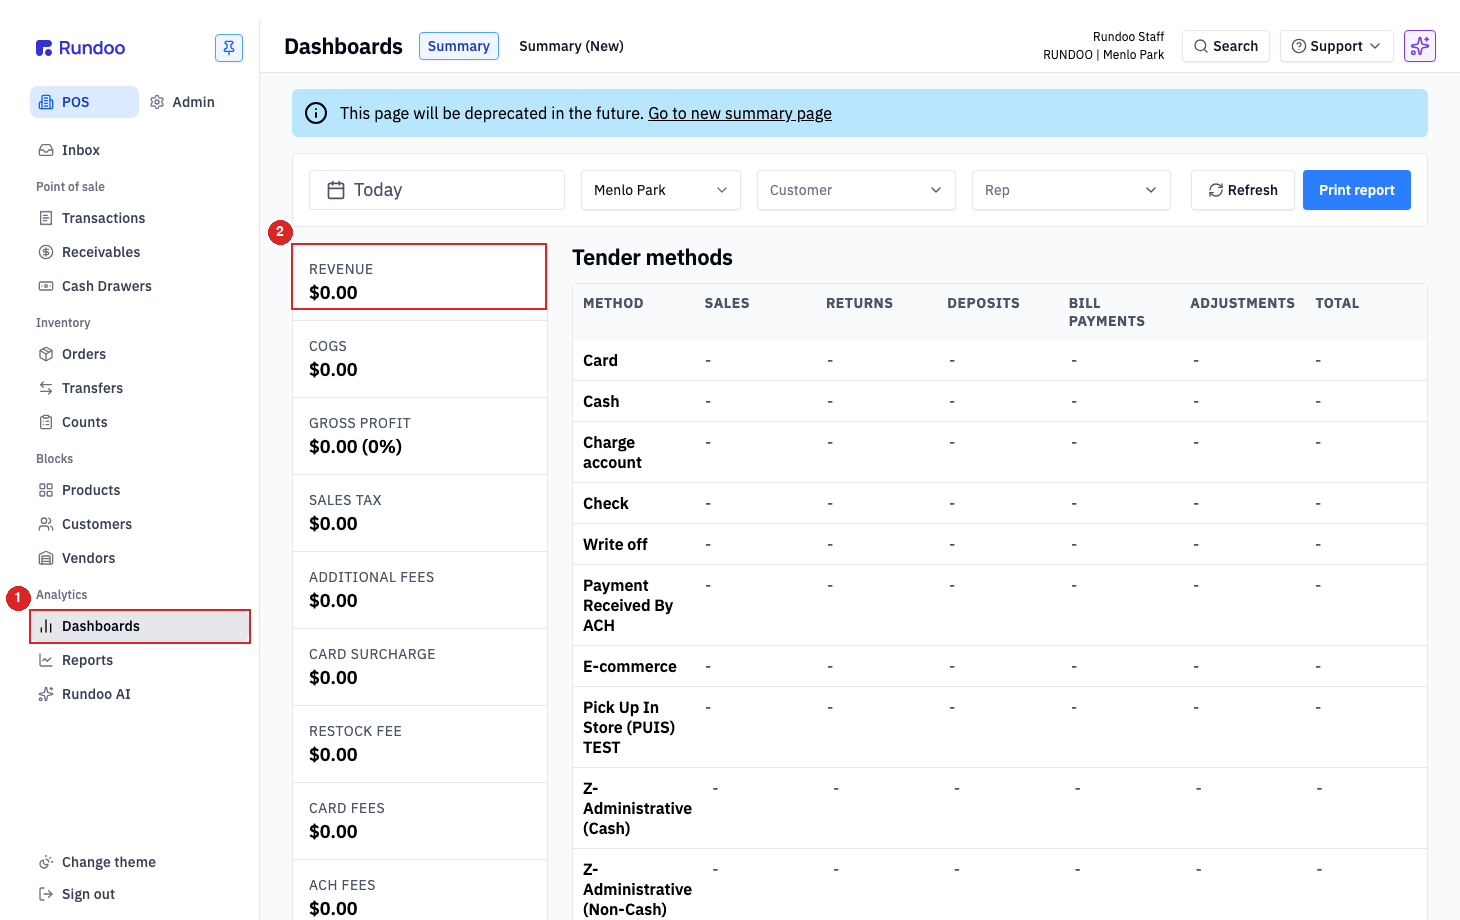
In the POS mode, open Dashboards under the Analytics group in the left sidebar. Rundoo ships one dashboard today (Summary) and every value on the page is a live link into the underlying report.
Dashboards are gated by staff permissions. Cashiers without View dashboards won't see the entry under Analytics, and roles without View product costs see KPI tiles like COGS and Gross profit blank rather than populated. Set permissions per role at Admin > Security > Staff permissions.
What's on the dashboard
The Summary dashboard is a two-column layout. A stack of KPI tiles runs down the left edge, one headline number per tile. The right side stacks breakdown tables that open up the totals by tender method and by product department.
Left-column tiles (top to bottom):
-
Sale revenue(sales for the period, before discounts). This tile was previously labeledRevenue. -
Sale discount revenue(the total discounts given on those sales). -
Sale revenue net(Sale revenueminusSale discount revenue, the after-discount figure). This is the number that lines up with what posts to your books and exports to QuickBooks. See Reconciliation gotchas below. -
COGS(cost of goods sold). -
Gross profit(revenue minus COGS), with the margin percent in parentheses. -
Sales tax, tax collected on sold products. -
Additional fees(any additional fees applied at the line-item level). -
Card surcharge(credit-card surcharges passed through to customers). -
Restock fee(restock fees on returns). -
Card fees(fees Rundoo paid to process card payments) -
ACH fees(fees Rundoo paid to process ACH payments). -
Write offs(balances written off in the period) (with a count). -
Petty cash(petty-cash draws from the drawer (with a count)). -
Over / Short(drawer variance at close-out) (with a count). -
Bank deposit, total deposited to the bank.
Right-column tables:
-
Tender methods(rows per tender (Card, Cash, Charge account, Check, Write off, Payment Received By ACH, E-commerce, Pick Up In Store (PUIS) TEST, Z-Administrative (Cash), Z-Administrative (Non-Cash), P FINANCE CHARGES, ACH, Gift card, VBucks, Total)), columnsSALES · RETURNS · DEPOSITS · BILL PAYMENTS · ADJUSTMENTS · TOTAL. -
Product departments. Revenue, COGS, and gross profit rolled up by department (Appliances & Electronics, Automotive, Benjamin Moore, Building Materials, Cabinet Paint, …).
Dashboard data is near-real-time but can lag by a minute or two. Hit Refresh if you just rang up a sale and want the numbers caught up.
Date range and filters
Four controls across the top of the dashboard shape what you see:
-
Date range (the leftmost pill (
Today,Month to date, etc.)). -
Location, the store whose numbers are shown (
Menlo Park,All locations, …). -
Customer, optional filter to scope the dashboard to one customer's activity.
-
Rep (optional filter to scope to one sales rep).
Refresh re-runs the queries on demand. Print report exports the current view.
Click the date pill to open the range picker. You get eight presets on the right (Today, Yesterday, Week to date, Last week, Month to date, Last month, Year to date, Last year) and a calendar on the left for picking a custom start / end pair.
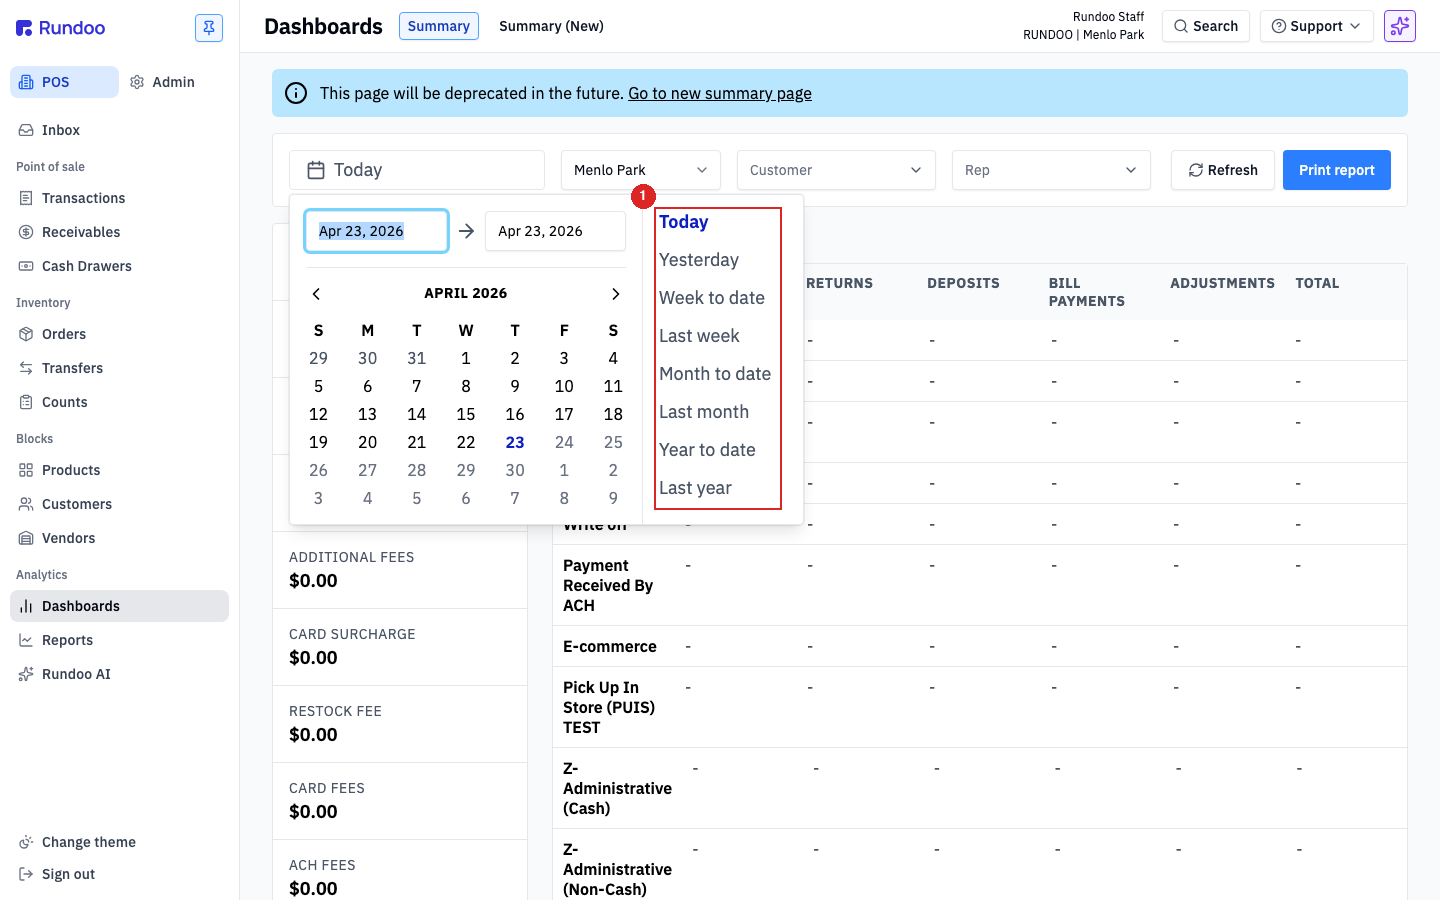
Date range defaults to Today, so most tiles will read $0.00 first thing in the morning. Switch to Month to date or Year to date for the views you'll actually use during a management review.
Click the location pill to scope the dashboard to one store, a group of stores, or All locations. Each location shows a single-letter avatar (B Menlo Park, C Palo Alto) matching the badges you see elsewhere in Rundoo.
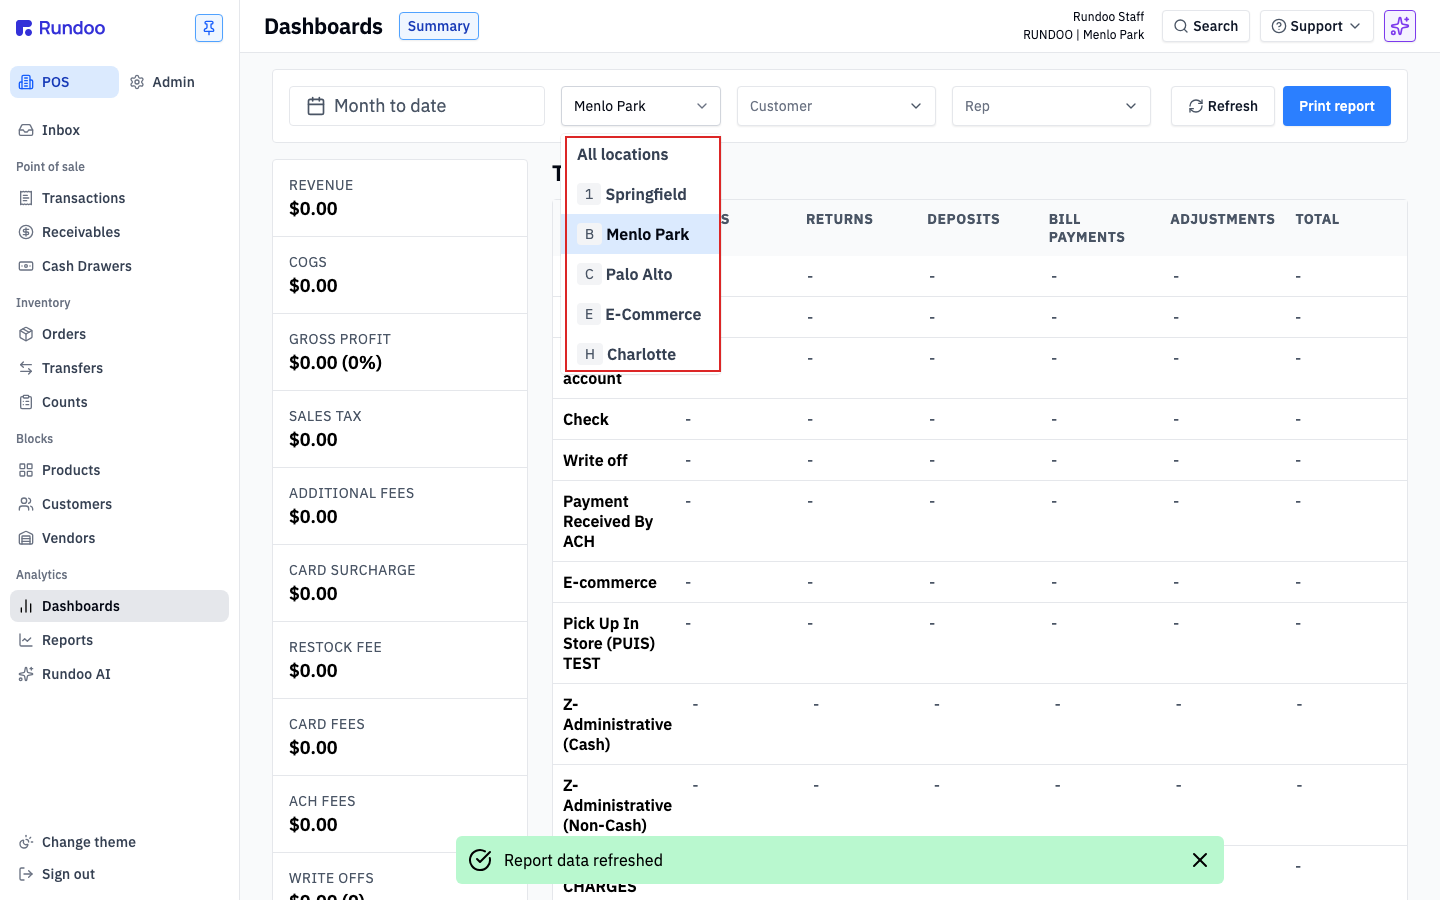
Seeing empty numbers? Refresh or widen the range.
The date range defaults to Today, and Today updates as the day progresses. Walk up to the dashboard first thing in the morning before any sales have rung up and most tiles read $0.00 (not a bug, just an empty day so far). If Profit & Loss shows revenue for the same day while Dashboards doesn't, you're usually looking at a timing gap: a sale posted a moment ago and the dashboard query hasn't caught up, or the tile you're reading is scoped differently than P&L.
Two quick moves:
-
Tap Refresh in the filter row to re-run the queries on demand. Dashboard data is near-real-time but can lag by a minute or two. A refresh closes that gap.
-
Switch Date range to
Month to datefor a populated view. That's the reliable default for a management-review glance;Todayis for end-of-day close (see the close-of-day section below).
If numbers still look empty or wrong after a refresh and a wider range, drill into the tile. See the next section.
Drill-through
Every number on the dashboard is a link. Click a tile value or a cell in one of the tables and Rundoo opens the underlying report in the Reports builder with the matching filters already applied (same date range, same location, same cut).
For example, clicking the Sale revenue tile value lands you on the Sales report with Distinct Date and time, Month to date, Location: Menlo Park, and Sale status: Paid, Sold pre-filtered. From there you can add columns, group differently, or save it as a custom report, no need to rebuild the filters by hand.
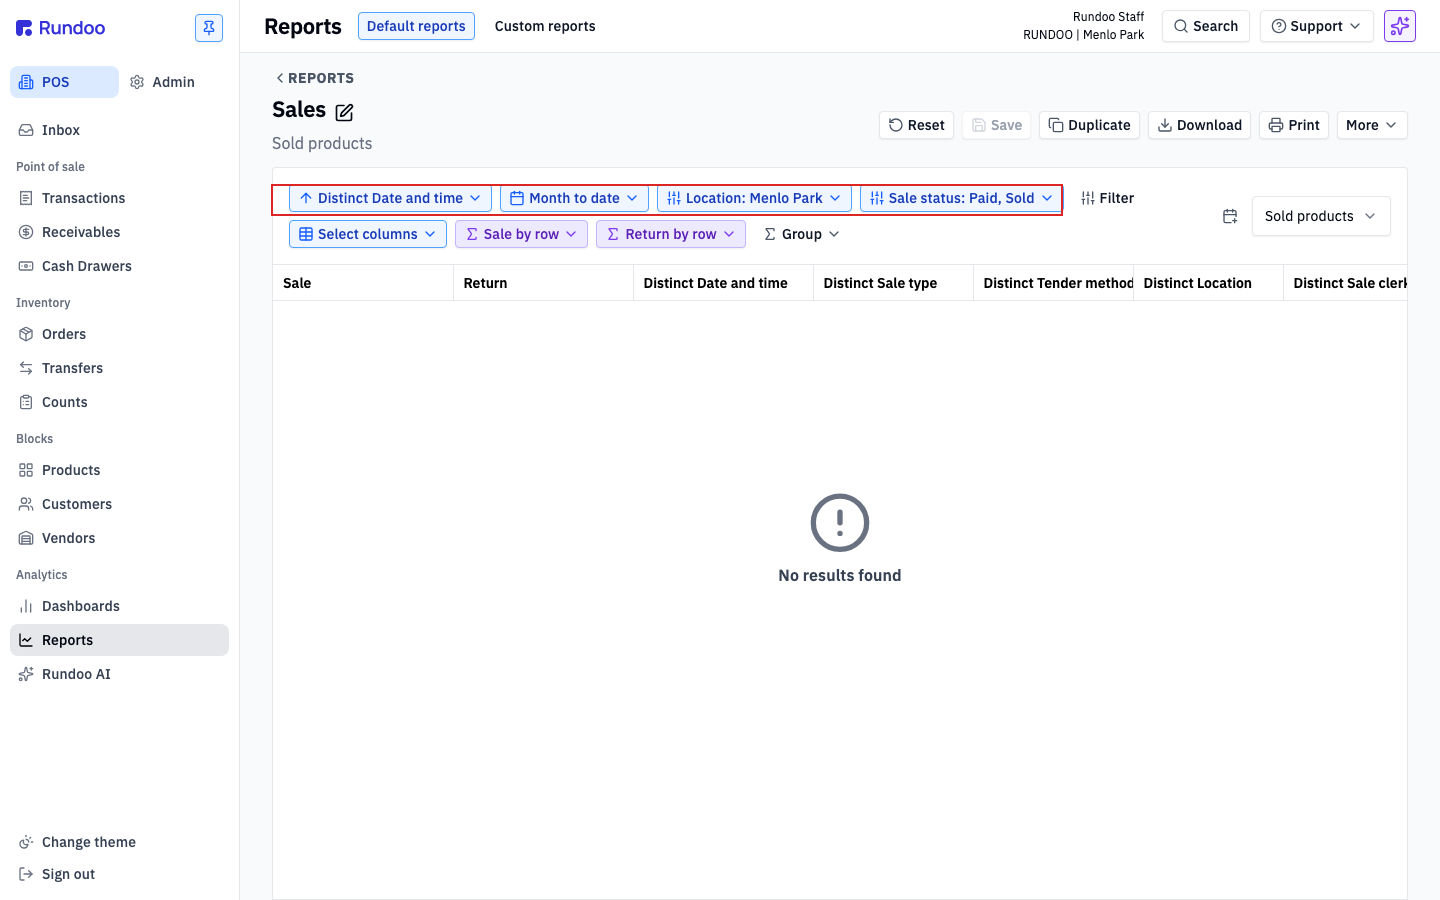
The destination report depends on which tile or cell you clicked:
-
Sale revenue,Sale discount revenue,Sale revenue net,COGS,Gross profit,Additional fees→Salesreport. -
Sales tax→Taxesreport. -
Card surcharge,Card fees,ACH fees→Payments summary/Paymentsreports. -
Write offs→Write-offs by dayreport. -
Petty cash,Over / Short,Bank deposit→Cash registerreport. -
Tender methodsrows →Paymentsreport filtered to that method. -
Product departmentsrows →Sold productsreport filtered to that department.
If a tile shows an unexpected number, drilling through is usually faster than trying to reverse-engineer it in your head. The filtered report is the exact data the dashboard rolled up.
Using the dashboard for close-of-day
The Summary dashboard is built for end-of-day reconciliation (tying tender totals to drawer counts, processor settlements, and deposit slips). A clean daily close looks like this:
-
Set Date range to
Today(or the close date) and pick the Location you're closing. -
Scan the
Tender methodstable. Each row's TOTAL should match: -Cash→ your drawer count for the day.
-
Card→ the Stripe (or other processor) settlement report. -
Check→ checks in hand. -
Charge account→ today's posted charge-account sales (on Statements).
-
Check
Over / Short. Investigate anything outside your tolerance (drill into the tile to see which drawer session contributed). -
Confirm
Bank depositmatches what you're about to drop at the bank. -
Scan
Product departmentsfor unexpected zeros or negative gross profit, usually a mis-costed item or a missing department assignment. -
Tap Print report to attach to the deposit packet.
With Today selected, Print report produces the same one-page close-of-day summary as the Print today's summary button on the Cash drawer page. Either place works.
Reconciliation gotchas
The dashboard pulls from live data, so timing and valuation choices can make numbers look wrong when they aren't. The usual suspects:
-
Rundoo's revenue looks bigger than what's in QuickBooks? Compare
Sale revenue net, notSale revenue.Sale revenueis the total before discounts, so it will read higher than the figure your bookkeeper sees in QuickBooks (the export posts revenue net of discounts).Sale revenue net(Sale revenueminusSale discount revenue) is the apples-to-apples number to reconcile against QuickBooks and the Sales report. Before this breakout existed, the dashboard showed only the gross figure, which is why the two systems appeared not to tie out. -
Card fees and bank deposits post on different dates. Card sales ring today; the processor's settlement lands tomorrow (T+1) with fees netted. If you reconcile by sale date on one side and settlement date on the other, the two won't match by exactly one day's fees. Pick one date convention and stick to it.
-
FIFO back-dating can shift COGS retroactively. If you receive inventory with an invoice dated last week, Rundoo revalues COGS on every sale since then. A Gross profit that looked clean yesterday can move when today's receipts post. Rerun the dashboard after all receipts are in for the period. See Cost method.
-
Back-dated returns produce surprising negative days. A return processed today against a sale from last month subtracts from today's Revenue and COGS. If a day suddenly shows net negative, check Returns before assuming the numbers are broken.
-
Missing department shows as
$0. A product with noDepartmentassigned still sells, but its revenue doesn't roll up into any department row. Update the product's categorization and the number reappears. -
Negative tender total on the
Tender methodstable usually means net refunds on that tender exceeded sales, or a large adjustment posted. Drill in to see which transactions contributed.
Switching dashboards
Today Rundoo ships a single dashboard, Summary, visible as the pill next to the Dashboards page title. Additional pre-built dashboards (and user-configurable ones) are on the roadmap; when they ship, they'll appear as additional pills here.
For custom views in the meantime, drill into the tile closest to what you want and save the resulting filtered report as a custom report. See Custom reports for the flow. Or ask Dooey a one-liner and it will build the cut for you.