
Rundocs › Analytics
Custom reports
Last updated 2026-09-11
Custom reports are reports you build and save yourself in Rundoo's Report Builder. Same dataset, same columns, same filters each time, one click to run.
In POS mode, open the Analytics group in the left sidebar and click Reports. Your team's saved custom reports sit on the same Reports page as Rundoo's defaults. The Report type column tells them apart, and the Filter pill lets you narrow to Report type = Custom.
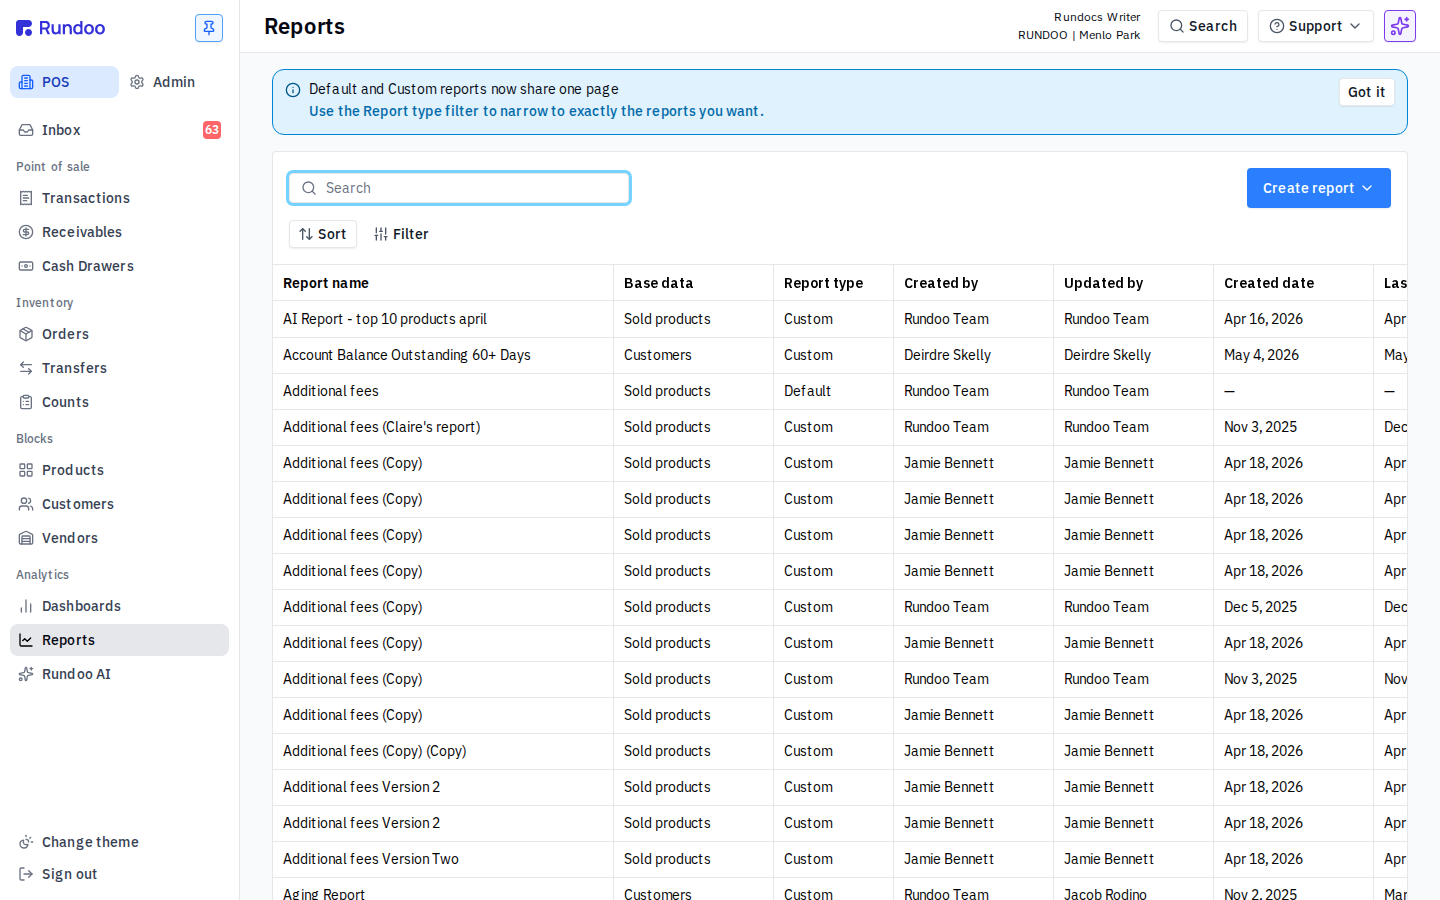
Custom vs default reports
Rundoo ships with ~50 default reports (Sales, Margin, Aging detail, Cash register detail, Taxes, the full list is in Running Reports). A default report is a preset your team can't edit, the columns, filters, and grouping are fixed. Open one, pick a date range, and run it.
A custom report is your own preset of the same Report Builder. You pick the dataset (Sold products, Transactions, Aging detail, etc.), the columns that matter to you, the filters that narrow to your slice, and the grouping you want, then save it under a name your whole team can reopen later. Defaults and custom reports coexist on one Reports page. The Report type column tags each row, and the Filter pill includes Report type if you want only one set:
-
Default, Rundoo's canonical ~50 presets. Can't be renamed or deleted.
-
Custom. Anything your team has built and saved. Fully editable.
The fastest way to make a custom report is to Duplicate a default report that's close to what you want, then edit it. You don't have to build from an empty dataset.
Building a custom report
From the Reports page, tap Create report at the top-right. A scrollable dropdown appears with every dataset the builder supports. The top of the list carries the everyday ones (Products, Customers, Sold products, Sales, Orders, Transfers, Interactions, Vendors), and scrolling reveals more specialized ones (Transactions, Jobs, Inventory, Aging detail, Taxable transactions, Price rules, Spiffs, Gift card balances, Single entries (POS), Agents, Payout transactions, and others). Pick one and you land in the builder.
Single entries (POS) is the row-per-GL-posting dataset (one row per single entry on the POS side of the ledger). It's what you reach for to debug or reconcile POS transactions in accounting: tying a sale's tender to its GL tax account, its department revenue, and its cost of goods, line by line. It's also what Dooey queries when you ask reconciliation questions.
Price rules is the dataset for auditing every alternate price, quantity break, promotion, and custom price configured across your catalog. One row per rule. Use it to answer "which products have a quantity break configured?" or "show me every custom price expiring this month." Pair it with columns like Product name, Base quantity, Percentage, Start date, Expiration date. See Product prices for how alternate pricing is configured.
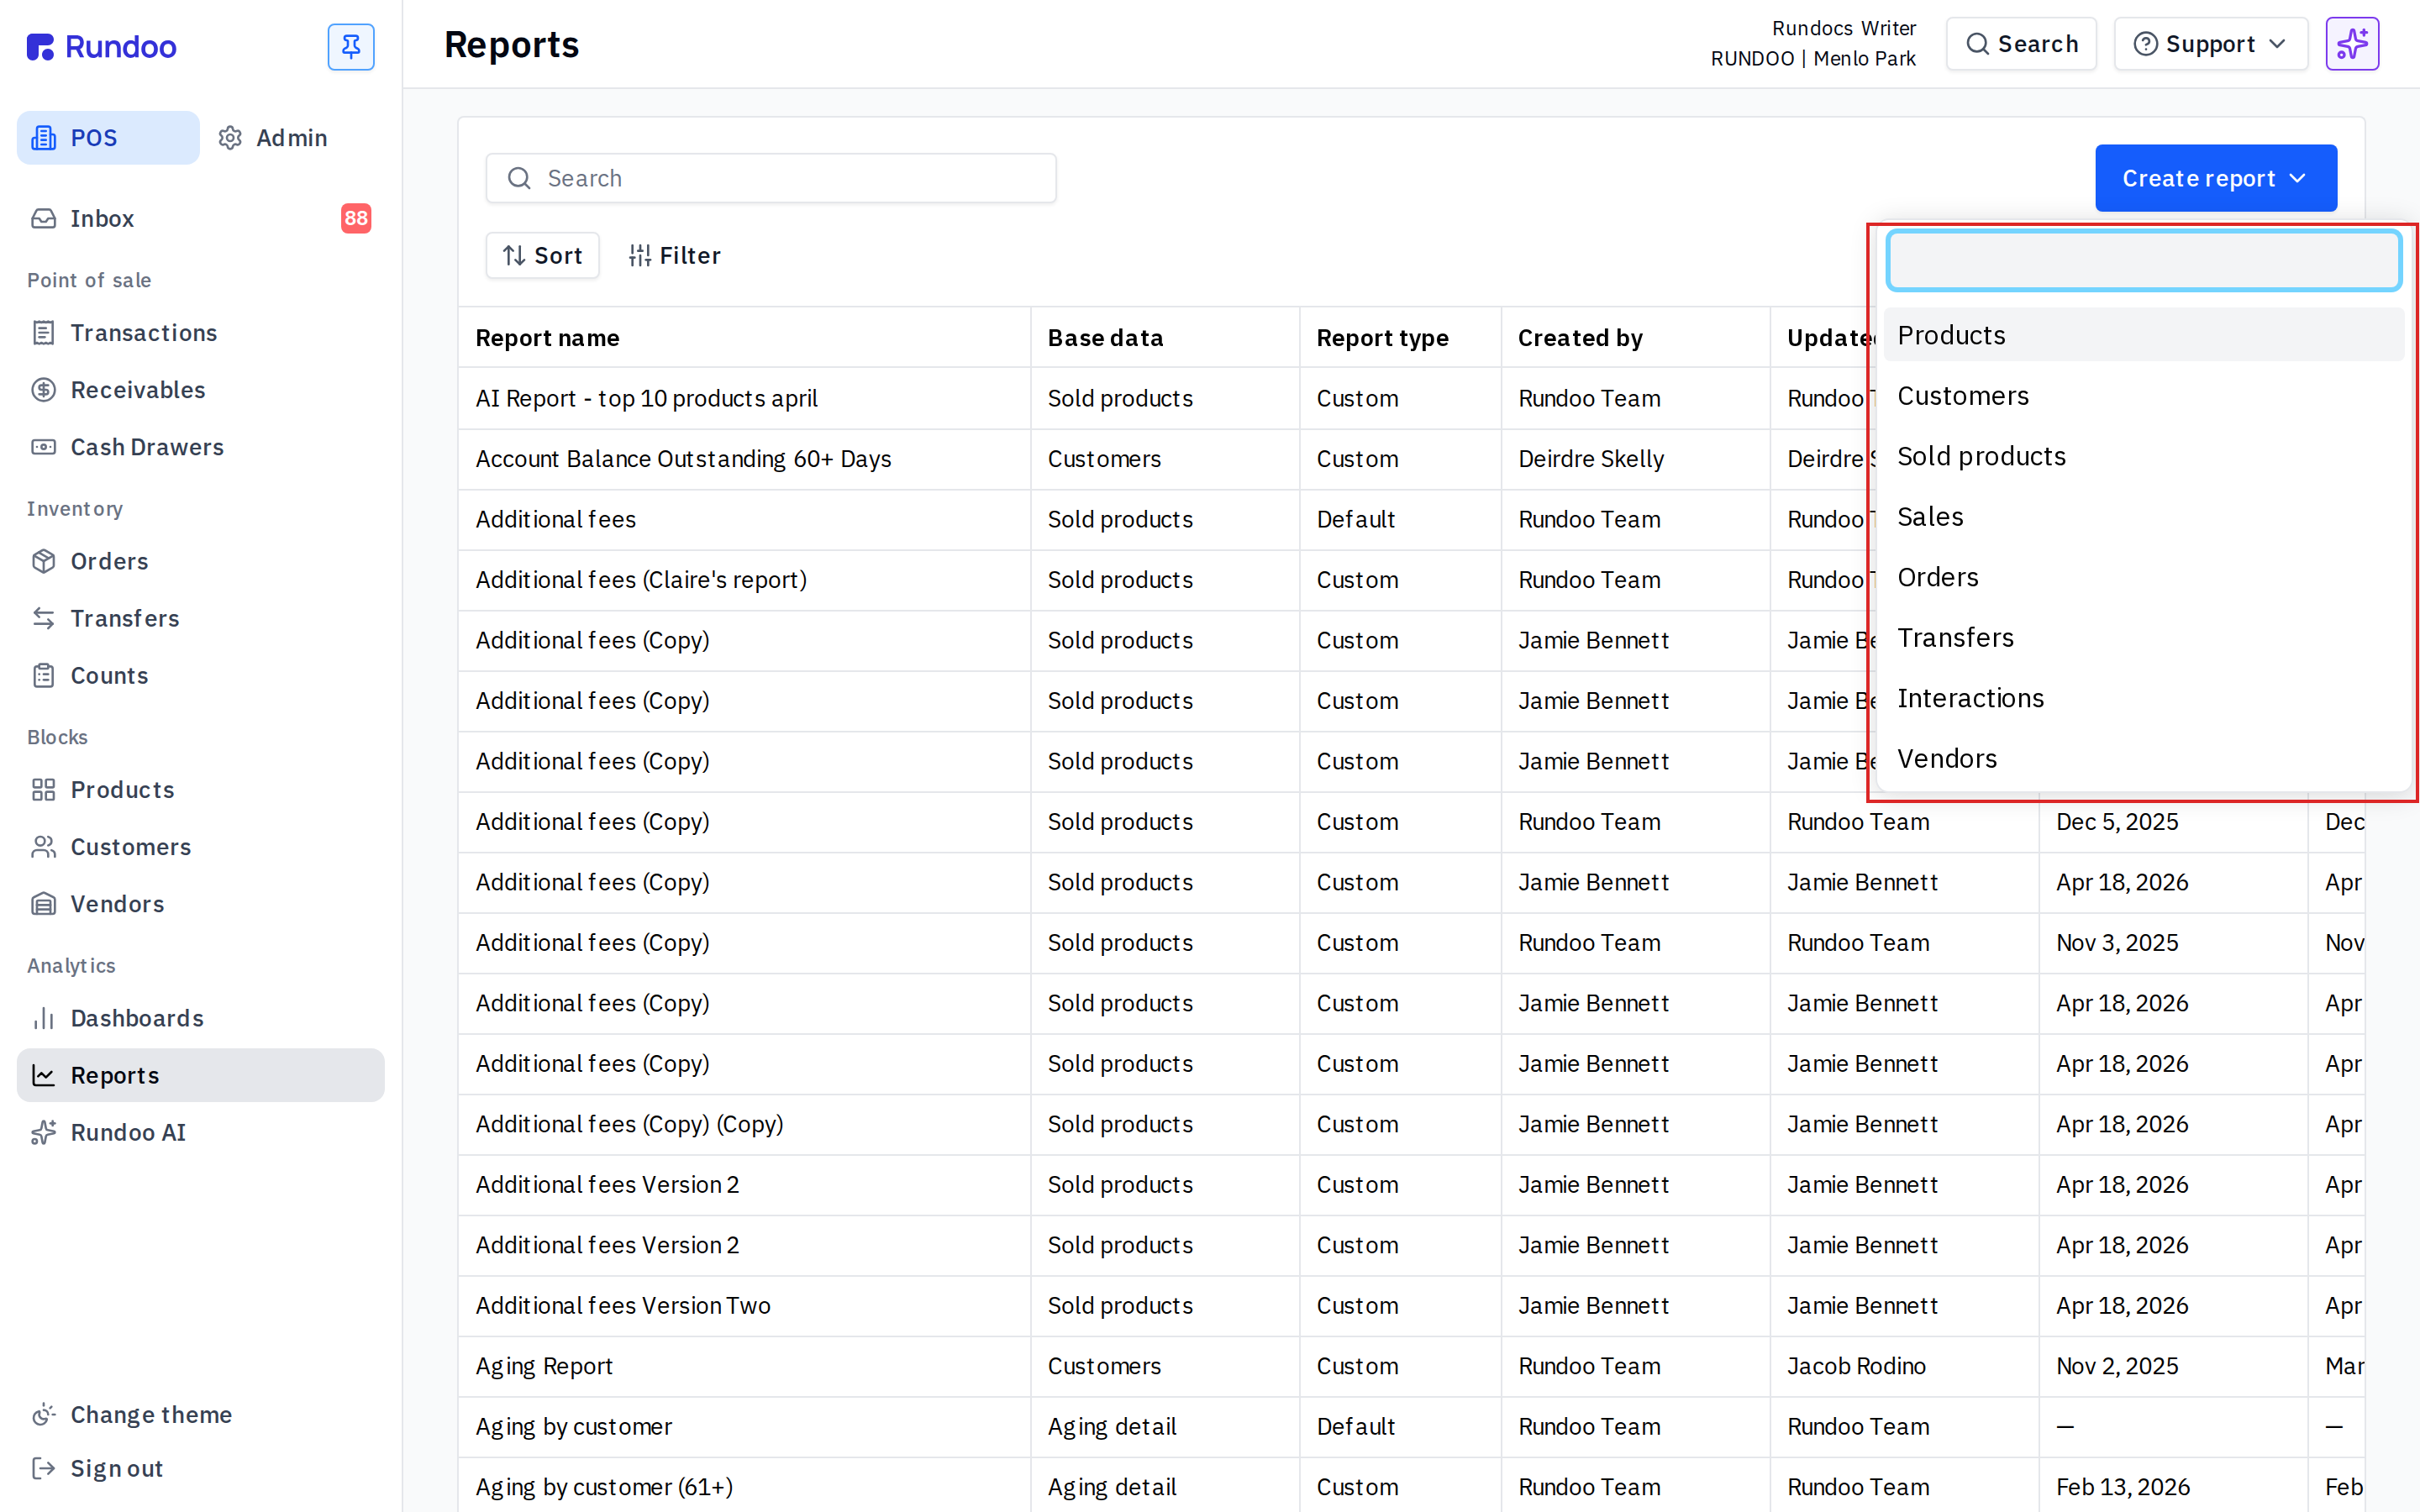
Each dataset decides what a single row in your report means (Sold products gives you one row per line item sold, Customers gives you one row per customer account, Orders gives you one row per purchase order). Pick the row shape first; everything else (which columns make sense, which filters apply) flows from that choice.
Once you're in the builder, five controls shape the report:
-
Sort, the leftmost pill. Order rows by any column ascending or descending.
-
Date range. The colored pill (e.g.
Mar 31, 2026 - Apr 16, 2026). Click it to pick any window or preset (Today,Month to date,Year to date). -
Filter. Narrows the rows. Add one per attribute you want to constrain: a specific location, a specific customer, a product department, a status.
-
Select columns (the white
Select columnspill). Tap it and pick which attributes show up as columns. Every dataset has dozens of eligible columns; only the ones you pick render. -
Group (the
Grouppill at the right end of the pills row). Rolls rows up by an attribute (e.g. groupSold productsbyProduct departmentto get a per-department total). Leave ungrouped to see raw rows.
Purple pills on the controls row are metric columns. Numeric fields that aggregate when you group (e.g. Sold product quantity sold net by row, Sold product revenue net by row). Light-grey pills are attribute columns. The mix is up to you.
Need a customer's signup date? Pick the Customers dataset and add the Customer created at and Customer created by columns (that's where account-creation timestamps live). The Products dataset doesn't track when products were added; if you want to audit your catalog by date, run it from a sales angle (e.g. Sold products filtered to recent activity).
Base data reference
Every report starts by picking a base data (the dataset), that choice decides what one row means and which columns and filters you can add. Below is each base data the builder offers, what a single row represents, and the signature columns that make it useful. Pick the dataset by the row shape you want first; the columns follow. (A few highly specialized datasets live in the builder too and aren't expanded here.)
Most datasets also carry the shared dimension columns, Customer …, Product …, Location, and the date parts (Date, Month, Year, Day of week), so you can filter and group any dataset by customer, product, location, or time. The columns in each toggle below are the ones unique to that base data.
Products
One row per product (per location). The catalog itself (reach for it) to audit your item list, stock levels, and reorder points.
-
Product department / Product fineline / Product class (the merchandising hierarchy you group and slice the catalog by)
-
Product current stock qty / Product location on hand qty (what's physically on the shelf, company-wide vs at one store)
-
Product min / Product max, the reorder points that drive replenishment
-
Product average cost / Product standard cost, valuation and margin math per item
-
Product default vendor, who you reorder each item from
-
Product is non stock / is special orderable / is tintable. Flags that explain how an item behaves at the register
Customers
One row per customer account. The follow-up-call list and credit file. Most A/R and account questions start here.
-
Customer balance total + Customer balance 1 30 / 31 60 / 61 plus days. The A/R aging buckets behind a past-due list
-
Customer credit limit / Customer credit hold (who's over their limit or on hold)
-
Customer average days to pay (how slowly an account actually pays)
-
Customer pricing tier, which price level the customer gets
-
Customer sales rep, who owns the account
-
Customer created at / Customer last sale at (signup date and recency for cohort or win-back work)
Sold products
One row per line item sold or returned. The grain for margin and product-level sales analysis.
-
Sold product quantity sold / returned / net (units moved, net of returns)
-
Sold product revenue sold / returned / net (line revenue, net of returns)
-
Sold product cogs / gross profit / gross margin (profitability per line)
-
Sold product is price edited / price edit impact, where clerks discounted off the standard price. To build your own discounts-applied-to-sales report, start from
Sold products, addSold product price edit impact(the discount amount, shown as a negative) andSold product is price edited(flags which lines were discounted), then group by clerk, customer, or product. (Register discounts are recorded as price edits, so this is where they land, not the Receivables early-payment discount.) -
Sold product tint code / tint name / tint company (tint-level reporting for paint)
-
Sale status / Sale type / Tender method (filter to completed vs voided, sale vs quote, how it was paid)
Sales
One row per sale (the whole ticket). Use it for per-transaction totals (it avoids the line-count sum-explosion you hit summing Sold products).
-
Sale revenue / Sale subtotal / Sale total (ticket-level money, summed safely once per sale)
-
Sale discount revenue / Sale revenue net (
Sale revenueis before discounts;Sale revenue netis after them, the figure that ties to QuickBooks. Add both when you're reconciling the Dashboard or your books.) -
Sale sales tax / Sale fees / Sale card surcharge (tax and fee reconciliation per ticket)
-
Sale restock fee, restocking charges applied on returns
-
Sale status / Sale type / Sale is paid (completed vs void, sale vs quote, paid vs open)
-
Sale sold by / Sale designated clerk (clerk performance at the ticket level)
-
Sale purchase order name / Sale buyer (tie a sale to a customer PO and buyer)
Orders
One row per purchase order (PO). The open-and-received view of what you've ordered from vendors.
-
Order status (open, received, or voided)
-
Order method / Order ship to, how the PO was placed and where it ships
-
Order ordered at / Order received at (+ by). The order and receiving timeline and who did each
-
Order total cost, the PO's cost value
-
Order product quantity ordered / received / discrepancy (per-line receiving detail on the PO)
Order shipments
One row per shipment line under a PO (and where receiving and vendor-payment (A/P) data actually live).
-
Order shipment status (shipped, received, vouchered, paid)
-
Order shipment invoice number / invoice date / invoice due date (the vendor invoice behind the shipment)
-
Order shipment marked paid at / by (when and by whom the vendor bill was paid)
-
Shipment products quantity received. What physically arrived, line by line
-
Order shipment total / subtotal / fee total, the dollars to reconcile against the vendor invoice
Transfers
One row per product line transferred between your locations. Tracks in-transit stock and receiving discrepancies.
-
Transfer from location / to location (the sending and receiving stores)
-
Transfer product quantity requested / sent / received (the three counts that should agree end-to-end)
-
Transfer product quantity delta / has discrepancy, where sent and received don't match
-
Transfer product value sent / received (the cost value moving between stores)
-
Transfer requested / sent / received at (+ by), the transfer timeline and who acted
Interactions
One row per logged customer interaction. Answers who-touched-which-customer-when.
-
Interaction staff, the team member who logged the interaction
-
Customer (+ Customer name) (which account the interaction was with)
-
Date / Date and time (when it happened), for activity reporting
Vendors
One row per vendor. Your vendor master-data and contact file.
-
Vendor name, the vendor record
-
Vendor phone / Vendor orders email (where you send POs and reach them)
-
Vendor mailing address / Vendor pay to (remittance and mailing details)
-
Vendor internal notes (team-only notes on the vendor)
Jobs
One row per customer job. Use it to roll a customer's activity up to a project (job-costing).
-
Job / Job name, the project a sale or interaction was tagged to
-
Customer (+ Customer name) (the account the job belongs to)
-
Customer balance / aging columns (carry the account's A/R alongside its jobs)
Transactions
One row per ledger transaction (GL posting). The reconciliation grain, every inventory, payment, and cash-drawer movement.
-
Transaction type / Transaction amount / Transaction status (what the posting is, how much, and its state)
-
Transaction is inventory / is cash / is receivable / is tax relevant. Flags to isolate the kind of posting you're reconciling
-
Transaction running stock / running valuation / running average cost. The running inventory position after each movement
-
Payment processing fees / processing net / Payment surcharge (card-fee tie-out on payments)
-
Bill payment / Finance charge / Gift card transaction amount, non-sale postings (A/R payments, finance charges, gift cards)
-
Close out (pennies … hundreds). Cash-drawer closeout counts by denomination
Single entries (POS)
One row per single entry on the POS side of the ledger (the row-per-GL-posting view). It's what you reach for to debug or reconcile a POS sale in accounting, and what Dooey queries for reconciliation questions.
-
Tender → GL tax account, tie a sale's tender to the tax account it posted to
-
Department revenue, the revenue account each line hit
-
Cost of goods, the COGS posting for the line
-
(see the Single entries (POS) note above) (the full line-by-line reconciliation use case)
Inventory
One row per product per location (a valuation and turns snapshot). The stock-health view.
-
Inventory on hand / on order / committed / stock (the four quantity positions for an item at a location)
-
Inventory on hand value / stock value / committed value, the dollars behind those positions
-
Inventory average cost (the cost each unit is valued at)
-
Inventory annual turns / annual units sold (how fast the item moves), your dead-stock lens
-
Inventory last sale date / last order date (recency, to flag stale stock)
-
Inventory min / max, reorder points for replenishment review
Aging detail
One row per open receivable transaction. Invoice-level A/R aging, the grain for a collections worklist.
-
Aging detail balance / days overdue / due date. How much is open, how late, and when it was due
-
Aging detail status / type, the state and kind of the open item
-
Aging balance current / 1 30 / 31 60 / 61 plus (and 61 to 90 / 91 plus), the aging buckets at invoice grain
-
Aging credits / Aging financing charges (credits and finance charges on the account)
-
Transaction / Transaction amount, the underlying posting behind the open item
Taxable transactions
One row per taxed transaction line. The grain for sales-tax filing and reconciliation by rate and jurisdiction.
-
Applied tax rate / Tax owed / Base sales tax (the rate applied and the tax due)
-
Taxable subtotal / Non taxable subtotal (the split that drives the tax calc)
-
Taxable fees / Non taxable fees / Taxable surcharge / Surcharge tax (tax treatment of fees and surcharges)
-
Tax rate name / Tax rate type (which rate and what kind)
-
Taxed location / Accounting location / Taxed sale, the jurisdiction and sale behind the tax
Price rules
One row per price rule. Audit every alternate price, quantity break, promotion, and tier across your catalog.
-
Price rule name / Price rule type (the rule and what kind it is)
-
Price rule product, the item the rule applies to
-
Price rule price strategy / fixed price / discount percent / margin percent (how the price is set). Fixed, % off, or target margin
-
Price rule tier name / tier rank / tier type (the customer-tier the rule is scoped to)
-
Price rule price rounding type / is price rounded up (how the computed price is rounded)
Spiffs
One row per spiff-eligible sold line. The grain for sales-incentive payout (who earned what over a spiff window).
-
Spiff name (the incentive program)
-
Spiff total spiff amount, the payout earned on the line
-
Spiff units sold / returned / net (the units that qualified, net of returns)
-
Spiff starts at / expires at (the window the spiff was active)
-
Spiff original sale clerk, who rang the qualifying sale
Gift card balances
One row per gift card. Your outstanding gift-card liability and activation/redemption audit.
-
Gift card current balance, what's still loaded on the card (the liability)
-
Gift card original amount / historical balance (how it was loaded and where it's been)
-
Gift card number last 4 / status. Identify the card and whether it's active
-
Gift card activation date / Gift card product, when and via what product it was issued
-
Clerk / Location (who issued it and where)
Agents
One row per staff member (clerk). The roster you join sales and transactions back to.
-
Staff name / Staff code (the person and their clerk code)
-
Staff email / Staff phone. Contact details
-
Staff roles (what the clerk is permissioned to do)
-
Staff created at (when the account was set up)
A worked example: customers with a past-due balance
A common A/R question (who owes me money that's past due?) needs the Customers dataset, not Aging detail. Customers gives you one row per customer account, which is what most teams want for a follow-up call list. Here's the recipe:
-
Create report → pick
Customers. One row per customer account. -
Set the date range to
All time. Customers who haven't transacted recently still owe. A tighter window can hide them. -
Select columns→ addCustomer name,Customer primary contact phone,Customer balance 1 30 days,Customer balance 31 60 days,Customer balance 61 plus days,Customer balance total. Past-due is the three aging buckets. There's no single "past due" column in this dataset. You add the three and read across. -
Sort by
Customer balance 61 plus daysdescending. Click theSortpill on the toolbar and pick that column. Customers with the worst aging float to the top; $0 customers sink to the bottom. Stop scrolling when you hit the $0 rows. (Clicking the column header itself opens a filter/aggregate menu, not a sort, see the gotcha below.) -
Save it as
Past-due customers — call list(or whatever your team will recognize). Any clerk with Reports access can reopen it in one click.
The Add filter bar doesn't expose dollar-amount thresholds. It filters on attributes like Location, Customer, Sales rep, Customer tag, and Customer Active, not on a balance number. For a numeric cutoff like "balance over $0," use the per-column filter instead: click the Customer balance 61 plus days header, choose Filter, set the operator to >, and type 0. That drops the $0 rows in place. (You can also just sort and stop scrolling, or Download to CSV and delete them in Excel.)
If you want one row per overdue invoice instead, to see exactly which transactions are pulling a customer's balance up, switch the dataset to Aging detail. Each row is one open invoice past its due date, with Aging detail days overdue, Aging detail balance, and the customer attached. Group by Customer name to roll it up to one row per customer.
Saving and naming
When the report looks right, tap Save in the action cluster top-right. The report gets a default name (usually the dataset). Click the pencil icon next to the title to rename it to something your team will recognize in a list. Name it the question it answers, not the dataset: Top 10 products this month, not Sold products report 3.
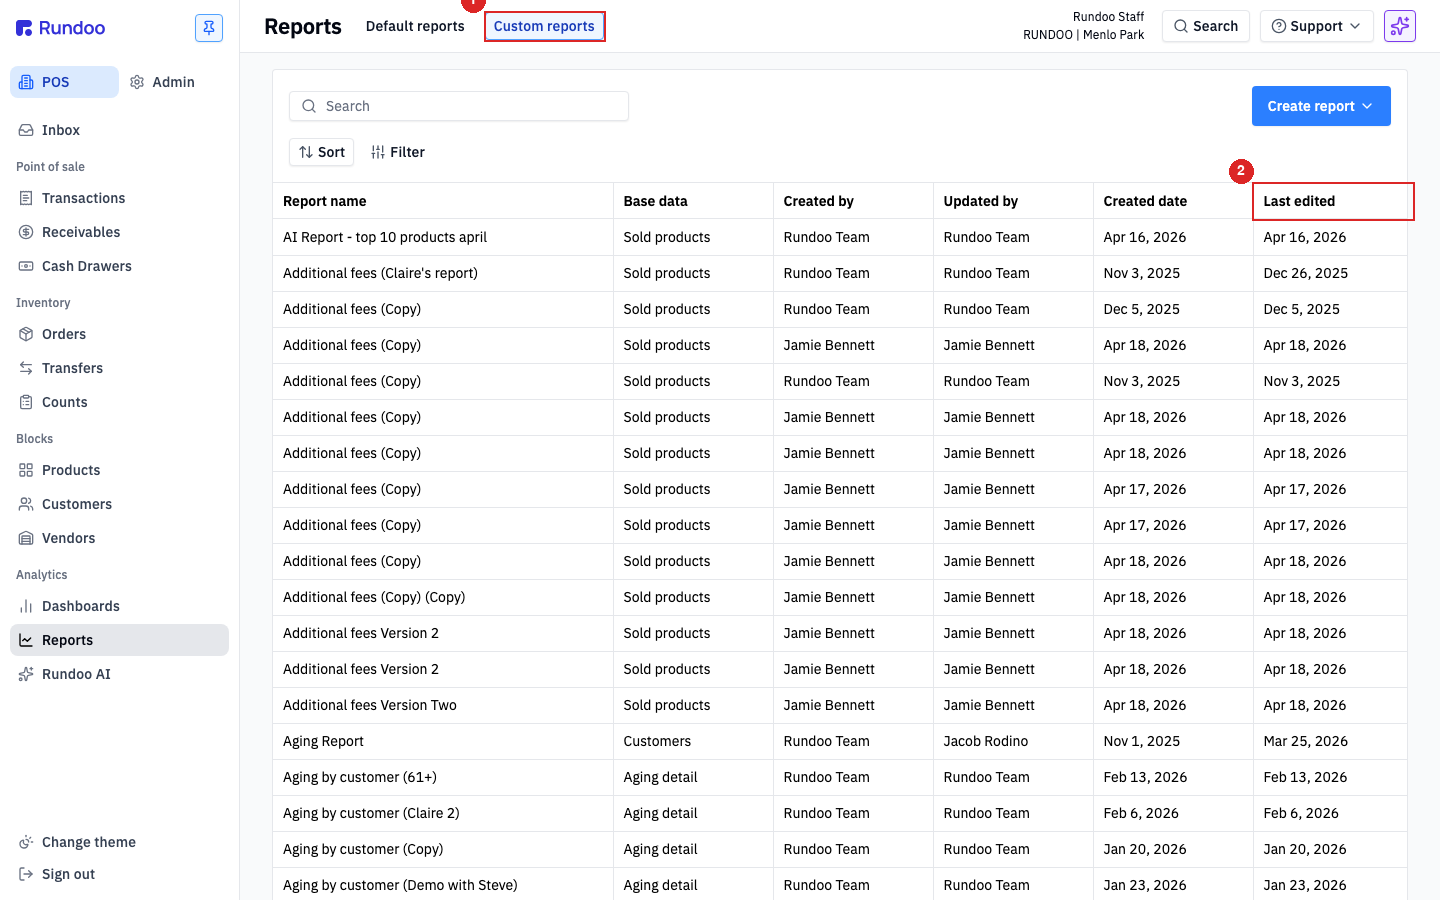
Saved custom reports show up on the same Reports page alongside the defaults, tagged Custom in the Report type column and sortable by any column (Report name, Base data, Report type, Created by, Updated by, Created date, Last edited). Everyone at your company with permission to view Reports can open them.
Need to share the result with someone who doesn't use Rundoo? Print ships a printable PDF; Download ships a CSV. Both are in the action cluster top-right of the report itself.
Editing or deleting a custom report
Open any saved custom report from the Custom reports top tab. You land on the same builder surface, pre-loaded with your saved columns, filters, and grouping.
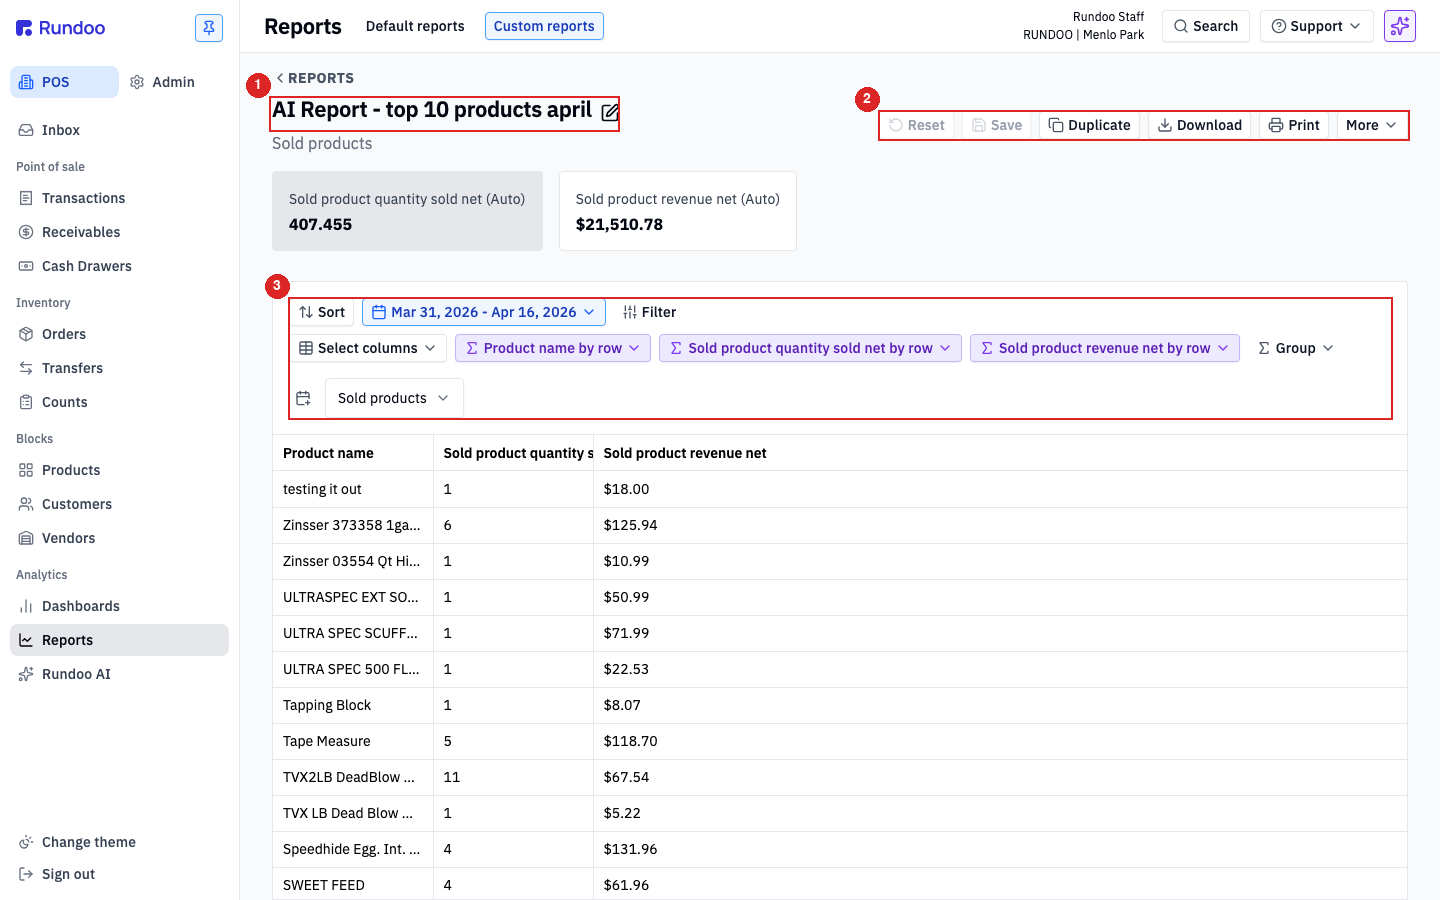
The action cluster top-right has everything you need:
-
Reset, undo any unsaved edits and revert to the last saved version.
-
Save, persist your edits (button is disabled until you've changed something).
-
Duplicate. Copy the report into a new one you can edit without touching the original. Great for "almost what I want" situations.
-
Download. Export the current result set as a spreadsheet.
-
Print (render a printable PDF view).
-
More, drop-down with Delete (and any other admin-level actions your role allows).
Deleting a custom report is permanent and affects everyone. If a teammate built it and you're about to delete, check with them first.
Editing a custom report changes it for your whole team the moment you tap Save. There are no personal copies. If you want a private variant, Duplicate first, then edit the copy.
Sharing with teammates
Custom reports are shared by default (anyone at your company with permission to view Reports sees the full Custom reports list). There's no per-report sharing setting and no private/public toggle. Treat the list as a team workspace: name reports clearly, delete stale ones, duplicate before heavy edits.
If you want a teammate to see a specific report right now, send them the URL from your browser. Opening it drops them straight into the builder pre-loaded with your view.
Common gotchas
The builder is forgiving once you know its quirks, but the same five trip up most teams the first time around. Skim these before you spend an hour wondering why a number doesn't reconcile.
Tables cap at 1,000 rows; CSV downloads cap at 50,000
The on-screen result table is paginated to 1,000 rows for performance. If your filtered query returns more than that, the builder shows the first 1,000, your aggregates and totals at the top of the table still reflect every row, but the rows themselves stop at the cap. To get every row, click Download and the CSV ships up to 50,000 rows. Beyond 50,000, narrow the date range or add a filter.
Two ways to filter: the Add filter bar and per-column filters
There are two filter surfaces and they do different jobs. The Add filter bar above the table narrows on whole attributes and takes multi-select (pick several locations or products and it ORs them together). The attributes it offers depend on the dataset you picked: Customers shows Location, Customer, Sales rep, Customer tag, Customer Active; Sold products adds Clerk, Product, Vendor, Product category, Product tag, Sale, Tender method, Sale status, Sale type, Product type, and more. If the attribute you want isn't in the list, the dataset doesn't expose it, so switch to a dataset that does.
For a quick cut on a single column, click that column header instead. It opens a small menu with Filter and Aggregate. Filter applies a single-value predicate to just that column: pick an operator (=, ≠, >, <, ≥, ≤) and type one value. It takes one value only, so it can't take a comma or semicolon list or match several values at once (use the Add filter bar for that). Clicking a header does not sort; sorting lives on the separate Sort pill at the left of the toolbar.
Filters from either surface apply before grouping and aggregation, so adding one changes both which rows show and what the totals at the top of the table sum to.
Metric-column prefix and sum-explosion
Metric columns name their granularity in the prefix. Sold product revenue sold is per-line, Sale revenue is per-sale. If you mix granularities and let the builder sum them, you'll multiply revenue by line count (a 5-line sale's revenue gets summed five times). When you spot a total that looks N× too large, change Aggregate on the metric column from Sum to Avg, Min, or Max (those are line-count-safe).
Orders vs Order shipments
The Orders dataset is one row per PO. The Order shipments dataset is one row per shipment under a PO, and that's where receiving and payment data live. If you're trying to report on what was received last month or what was paid last week and it's not showing up, switch the base dataset from Orders to Order shipments before adding columns.
Default date range varies per dataset
The date pill at the top filters against each dataset's default timestamp (Sold at for Sold products and Sales, Accounted at for Transactions). Sales-shaped datasets default to a recent window (the last couple of weeks); catalog-shaped datasets like Products default to All time. The presets in the picker are the same either way (Today, Week to date, Month to date, Year to date, Last year, All time, plus a custom range), so always check what range is selected before reading the totals. A number that looks low at the start of the day is usually a Today filter the page opened with.
Default timestamps are stored in UTC. If a sale at 11:50 PM local time looks like it landed on the next day, that's the timezone. Not a bug.