
Rundocs › Accounting
Profit & Loss
Last updated 2026-04-24
The Profit & Loss is Rundoo's running income statement (income, COGS, gross profit, expenses, and net profit) for a date range you pick.
In the Admin > Reporting > Profit & loss tab, set a date range, click Run, and Rundoo pulls every journal entry for the range and rolls it up into the six account types from your Chart of Accounts.
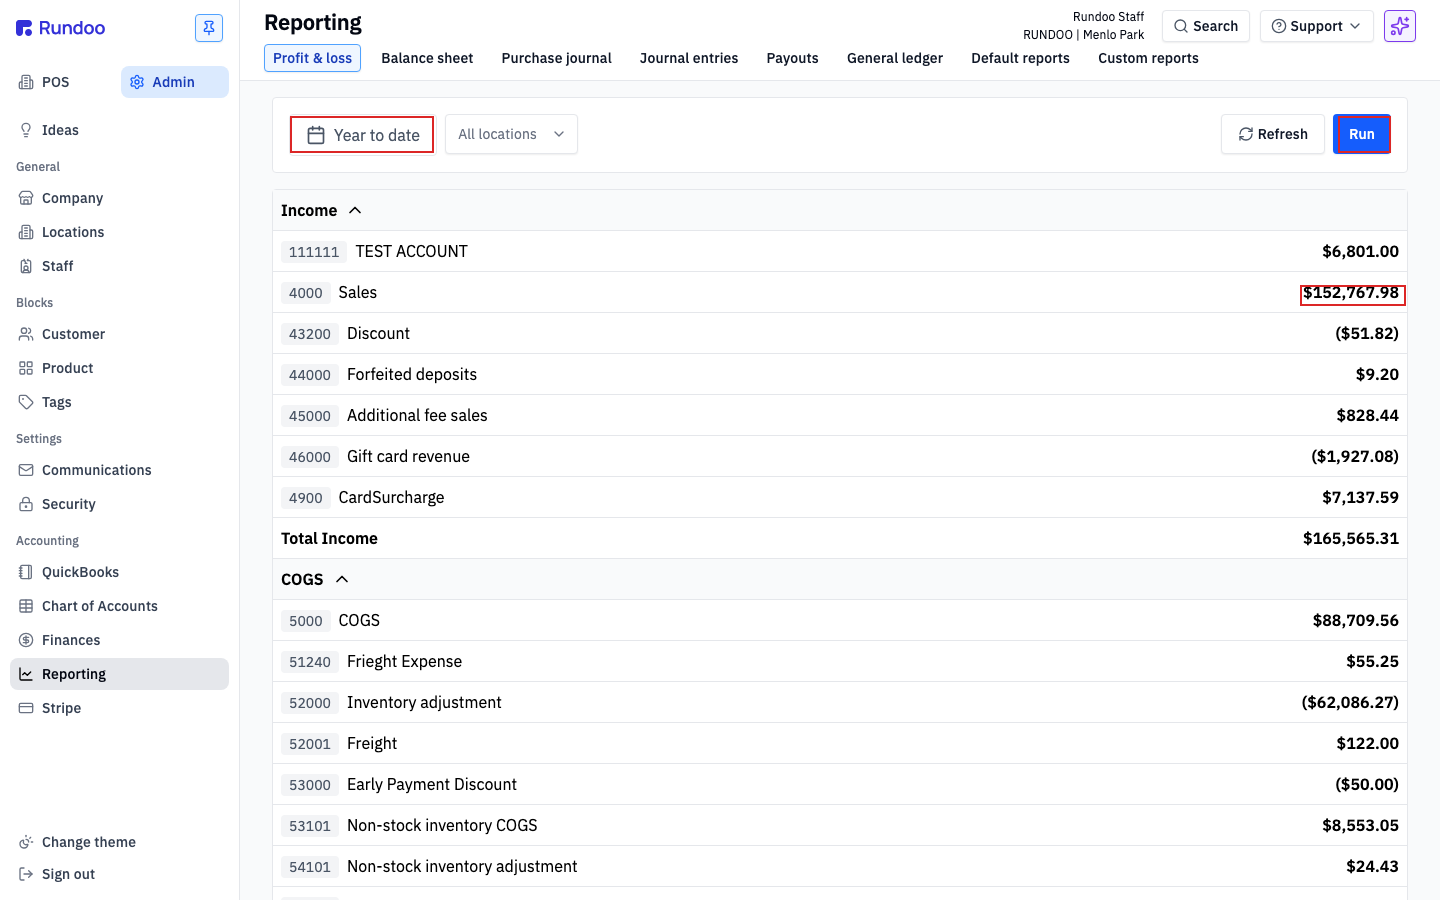
Running a P&L
The P&L doesn't render on page load (the date range isn't set yet). Open the Date pill on the filter bar, pick a range (calendar or preset), optionally narrow to a single Location, then click Run.
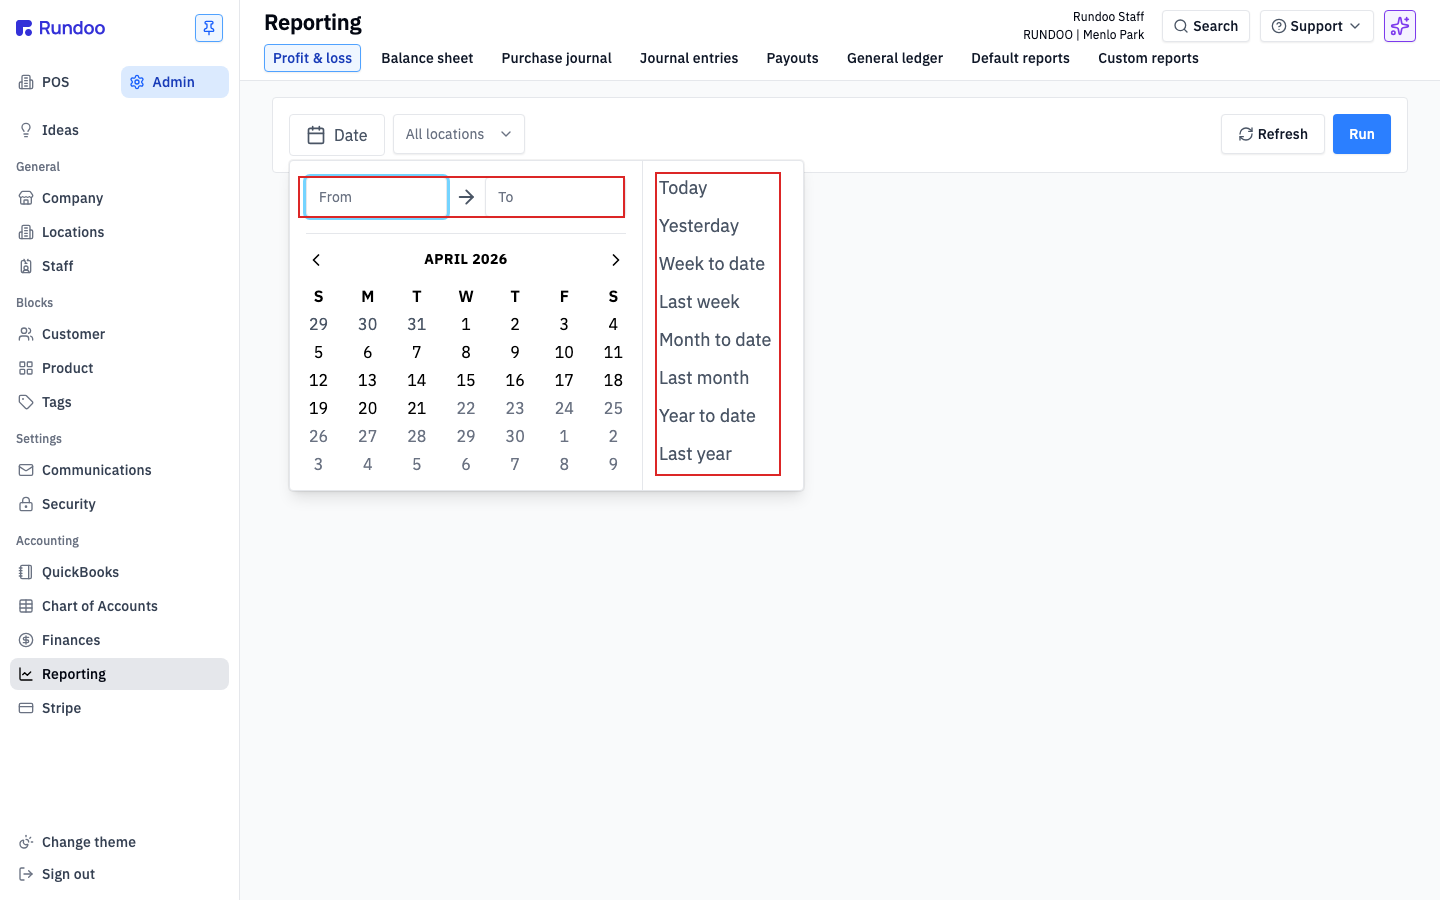
Location defaults to All locations. Switch it to a single store and the report recalculates to just that location's postings (useful for comparing stores or isolating a new-store ramp).
Click Run and the report pulls every journal entry that posted in the range and groups it by account.
If you click Run without picking a date, Rundoo shows a red banner "Date range cannot be empty. Please select a date." at the bottom of the page. The report won't render until a range is set.
Reading the report
The P&L is grouped into three sections, Income, COGS, and Expense, with two calculated totals in between: Gross profit and Net profit. Each account appears as a row with its account number on the left, account name in the middle, and the period total on the right.
Income is the top section. Every Income-typed account in your Chart of Accounts that posted in the range shows up here, Sales, CardSurcharge (credit-card surcharges billed back to customers), Discount, Additional fee sales, Gift card revenue, Forfeited deposits. The section total appears as Total Income at the bottom.
COGS is next (every COGS-typed account). Rundoo ships with a single COGS account that catches inventory costs on sale, plus accounts for freight and inventory adjustments. The section total is Total COGS.
Gross profit is the line between COGS and Expense. It's Total Income − Total COGS, and Rundoo shows the gross-margin percentage right next to the dollar amount. If gross profit is negative, Rundoo renders the value in parentheses and the margin flips negative, immediate signal that inventory adjustments or freight are eating the margin.
Expense is the bottom section (every Expense-typed account). Things like CardFees (card processing), Wages, Petty cash, OverShort (cash-drawer variance), WriteOffs. The section total is Total Expense.
Net profit is the bottom line (Gross profit − Total Expense) with its own margin percentage.
Rundoo labels the bottom line Net profit, not "Net income." If you're used to reading QuickBooks or Xero, it's the same number, just a different name on the row.
Click the small caret (^) next to Income, COGS, or Expense to collapse the section and see just the subtotal. Helpful when you want to eyeball the gross and net on a big P&L without scrolling.
See the Chart of Accounts Rundoc for how each account type is defined and what transactions post to it.
Drill-through to transactions
Every dollar amount on the P&L is a link. Click a number (say the $152,767.98 next to Sales) and Rundoo takes you to the General ledger tab with the filters already set: the date range you ran, the specific account you clicked, and Sort: Date, Oldest so entries read top-to-bottom chronologically.
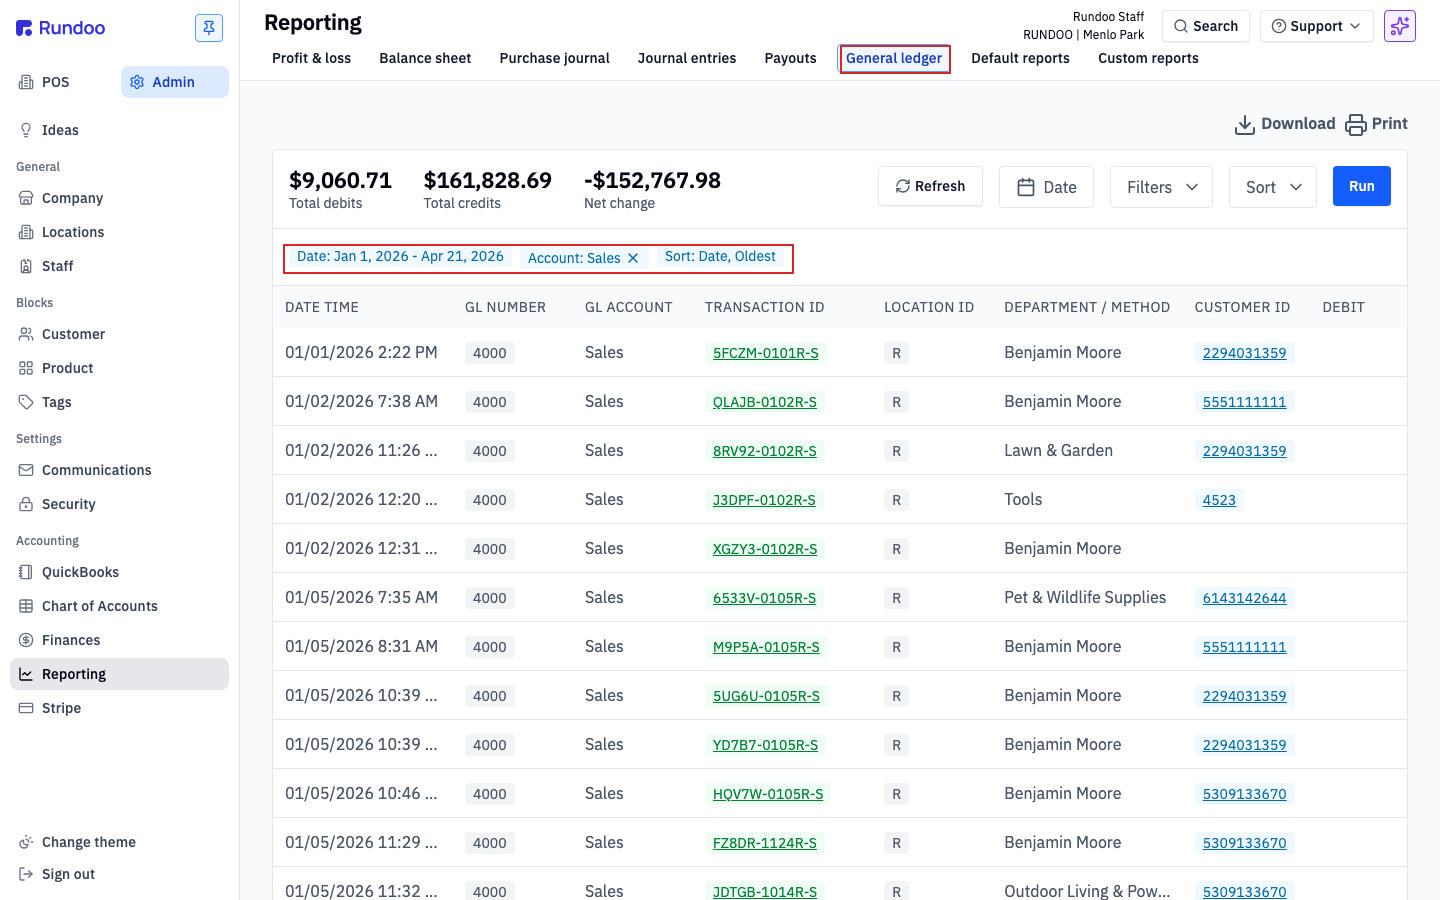
The drilled-through view shows every journal entry that rolled up into that number (date, GL number, account, transaction ID (linked back to the sale, order, or payment that produced it), location, department, customer, and debit/credit columns). Three summary pills at the top show Total debits, Total credits, and Net change. Net change for an income account equals the P&L number you clicked on.
The Transaction ID and Customer ID columns are themselves links. Click a transaction ID to open the underlying sale, order, or bill payment in a new tab; click a customer ID to jump to that customer's record. That's how you go from "our sales number looks off" to "this specific sale on Tuesday is the problem" in two clicks.
The drill-through lands on the General ledger report with Run report to see data (you still need to click Run on that page to pull the entries). The filters are already applied; you're just triggering the query.
Comparing periods
Rundoo doesn't have a built-in comparison column. The P&L shows one period at a time, not side-by-side. To compare, open the report in two browser tabs, run one with This month to date and the other with Last month, and eyeball them together. Or drill through a specific line on each to isolate what changed.
For recurring comparisons, the Default reports tab on the Reporting page lists Profit and loss as a base report you can build a custom report on top of. Useful if you want a cross-period view with its own saved filters.
Exporting
The Profit & loss tab itself doesn't have a Download or Print button. Export happens one level deeper, on the drilled-through General ledger view.
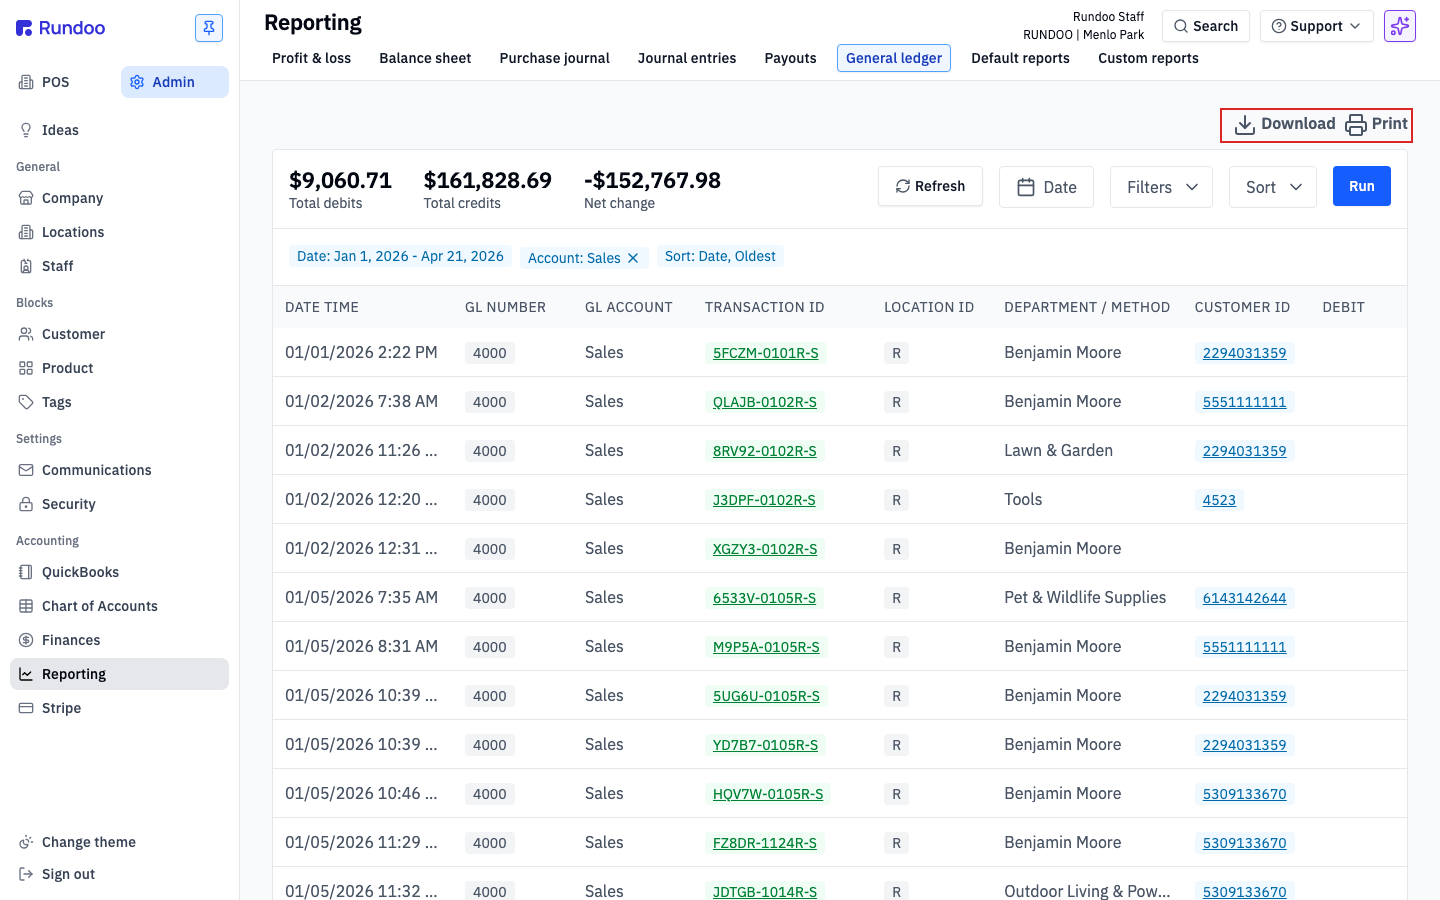
Click any dollar amount on the P&L to drill through, and the Download and Print icons appear at the top right of the resulting report. Download pulls a CSV of the filtered journal entries; Print opens the browser print dialog against a printer-friendly layout.
If you need a PDF of the P&L itself (say, to hand to your accountant at month-end) use your browser's File → Print → Save as PDF on the P&L page directly. The report is already laid out cleanly for printing; there's no separate export on that view.