
Rundocs › Accounting
Balance Sheet
Last updated 2026-08-31
The Balance Sheet is Rundoo's point-in-time snapshot of what your business owns, what it owes, and what's left over for the owners, Assets, Liabilities, and Equity, as of a single date you pick.
In the Admin > Reporting > Balance sheet tab, you pick an as-of-date and click Run. Rundoo walks every journal entry posted on or before that date and totals each account in your Chart of Accounts.
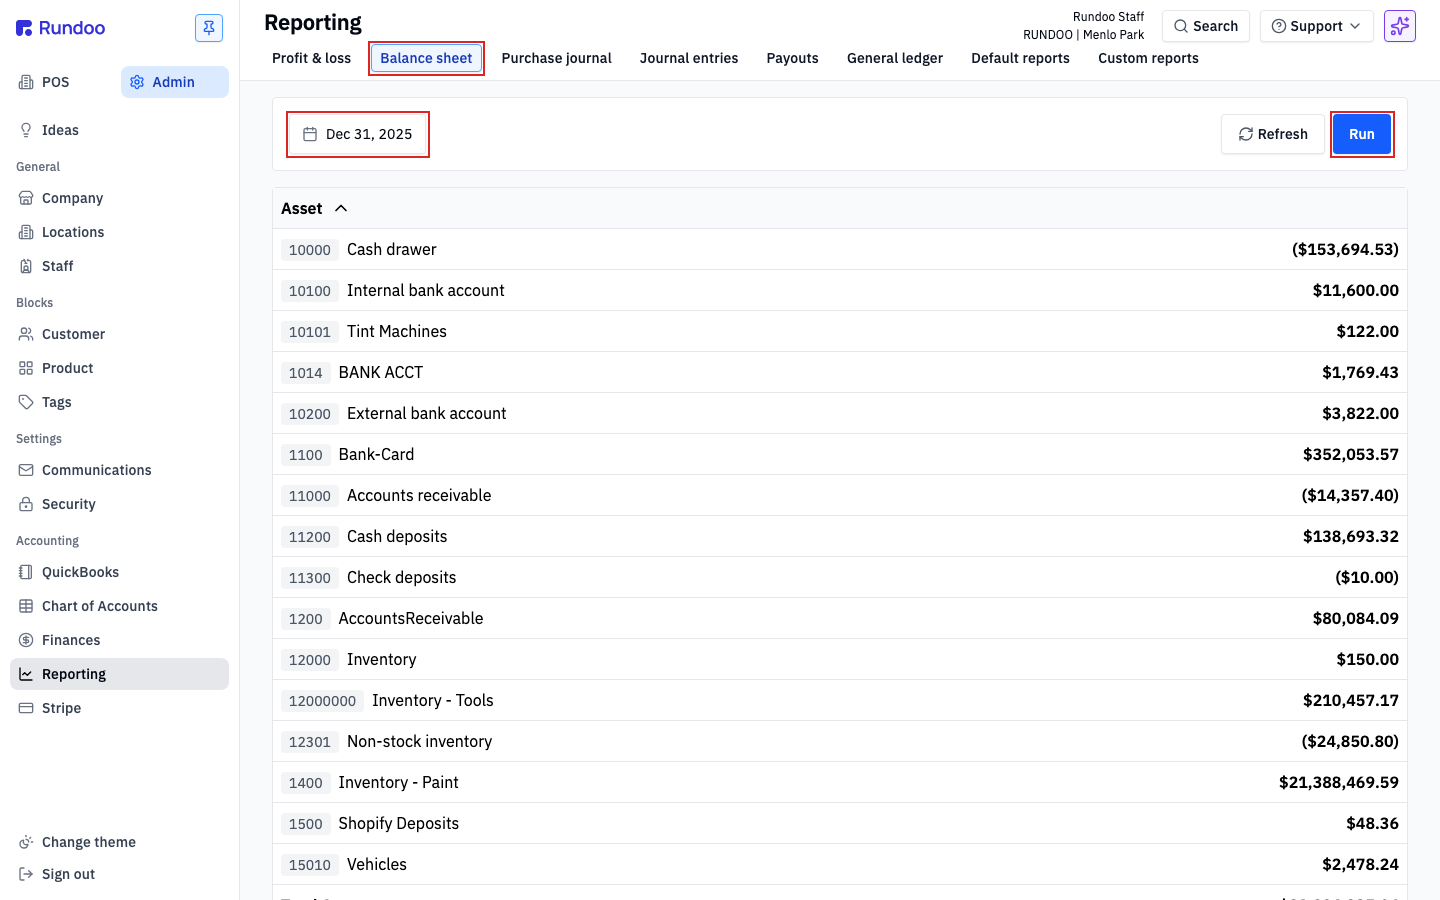
Running the Balance Sheet
The Balance sheet tab opens empty (no report runs by default). You pick the date you want, click Run, and Rundoo totals the ledger. Three steps:
-
Pick the as-of-date on the left of the filter bar. It defaults to
Today; click it to change. -
Click the blue
Runbutton at the right. The report usually returns in a few seconds. -
Click
Refreshto re-pull from the ledger if you've posted transactions since the last run (same date, freshest data).
The URL holds the date you picked (?date=2025-12-31…) so you can bookmark "year-end 2025" as a link and come back to the same snapshot with one click. Handy for month-end close: keep a browser tab open on each reporting date.
Reading the report
The report groups every active account by its Type from the Chart of Accounts, in the standard balance-sheet order: Assets first, then Liabilities, then Equity.
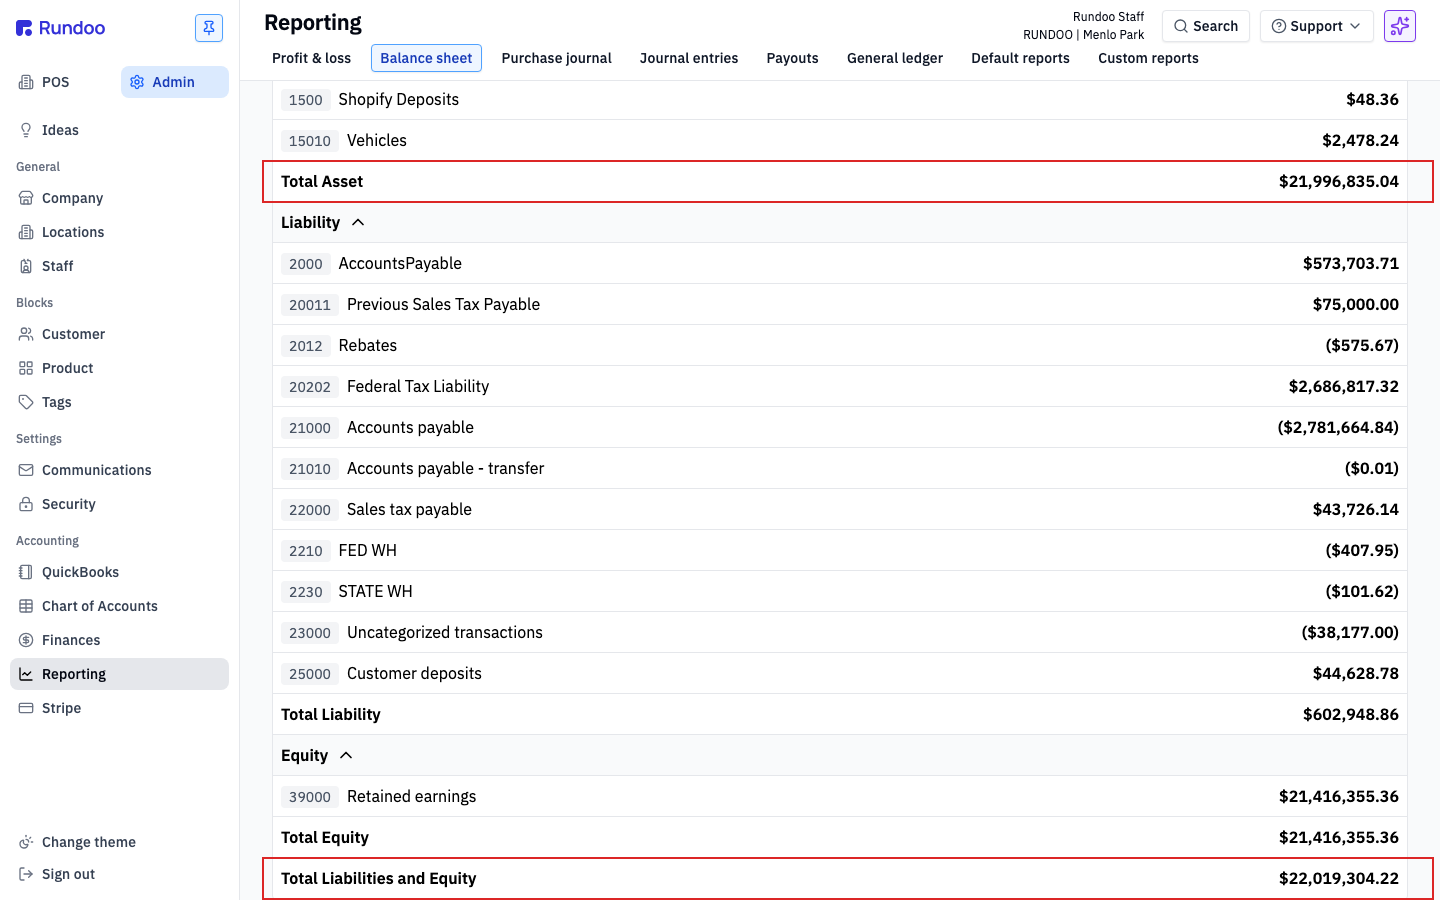
Each section shows one row per account (account number on the left, name in the middle, balance on the right). Negative balances show in parentheses (Rundoo's convention), so ($153,694.53) under Cash drawer means the cash drawer account has a negative balance as of the as-of-date.
At the bottom of each section, Rundoo prints a subtotal (Total Asset, Total Liability, Total Equity). And at the very bottom of the report, Total Liabilities and Equity (the sum that should match Total Asset if your books balance).
The three sections map to the standard accounting categories from the Chart of Accounts:
-
Asset accounts, cash, bank accounts, inventory value, accounts receivable, anything you own. Numbers in the 1000s in Rundoo's standard Chart of Accounts.
-
Liability accounts (accounts payable, sales tax payable, payroll withholdings, customer deposits). Anything you owe. Numbers in the 2000s.
-
Equity accounts, retained earnings, owner draws, opening balances (the owner's stake). Numbers in the 3000s.
Income (4000s), COGS (5000s), and Expense (6000s) accounts don't show up here. They're on the Profit & Loss instead. The Balance Sheet is a stocks report (positions at a moment); the P&L is a flows report (movement over a period).
As-of dates
The Balance Sheet is point-in-time, not a date range. You pick one date, and the report shows every account's balance at the close of business that day.
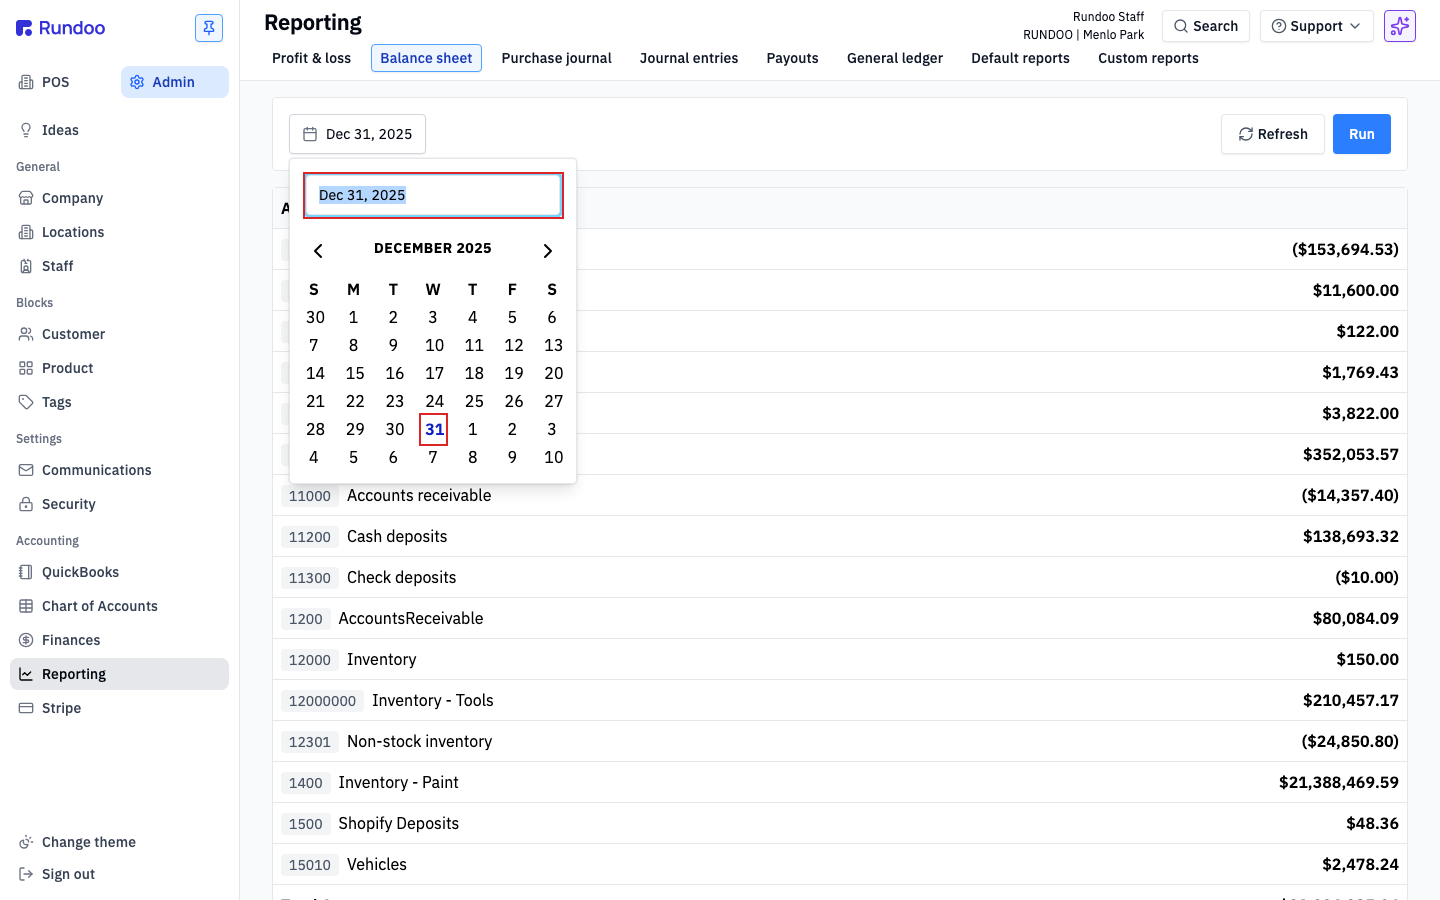
Click the date button in the filter bar, type or pick a date in the calendar popover, press Enter (or click outside to close), then click Run. Common choices:
-
Today, where the business stands right now.
-
Last day of the month (month-end close); the snapshot you'd send to your accountant or share with a lender.
-
Last day of the fiscal year (year-end); the starting point for retained-earnings roll-forward.
The report runs as of end-of-day on the date you pick, so Dec 31, 2025 includes every transaction posted through the close of that day. Not every Rundoo cashier knows this, and it's the most common "wait, why doesn't my number match my bank?" question at year-end. Double-check the date before exporting.
Unlike the Profit & Loss, there's no This month / Year to date range shortcut, because a balance sheet isn't a range, it's a snapshot. If you want to see how the business changed between two dates, run the report twice and compare.
The self-audit check
A balanced Balance Sheet means Assets = Liabilities + Equity. That's the accounting identity: every dollar the business owns was either borrowed (a liability) or put in by the owner / earned and kept (equity). If the two totals don't match, a journal entry is off somewhere.
Rundoo's live Balance Sheet doesn't flag imbalances on the report itself. It just shows Total Asset at the top and Total Liabilities and Equity at the bottom, and you eyeball whether they match. The two totals are boxed in the screenshot above. If those numbers disagree, look at your opening balances first.
Opening balances are set as a Manual journal entry (Admin > Manual Journal Entries), the balanced entry you post at cutover so Rundoo's reports line up with your old books from day one. If the identity doesn't hold, that opening entry is almost always where the imbalance is: its debit and credit totals should match, and it should split evenly between the three sides. Open it and check that Total debit equals Total credit.
Running balances (today's balances, not opening balances) can also drift, usually from an accounting setting change mid-year, a manual journal entry that didn't split evenly, or a QuickBooks sync that failed halfway. If the report imbalances but your opening entry ties out, check the most recent entries on Admin > Manual Journal Entries for one that's off.
Drill-through and export
The Balance Sheet rows are read-only. Clicking an account name doesn't drill into the transactions behind it. To see the journal entries that built up a balance, go to Admin > Reporting > General ledger, pick the same as-of-date (and a start date), filter by the account you want, and run.
There's no built-in export on the Balance Sheet tab itself. Two workarounds for sharing:
-
Browser print (
Cmd + Pon Mac,Ctrl + Pon Windows). Prints the full report with the date and totals. Save as PDF from the print dialog for email or filing. -
Share the URL. It includes your as-of-date, so anyone on your Rundoo company can open the link and see the same snapshot.
If you need the underlying account list as a spreadsheet (without balances), go to the Chart of Accounts and use Download spreadsheet at the bottom of the Accounts tab. It exports the full account list with starting balances and dates.